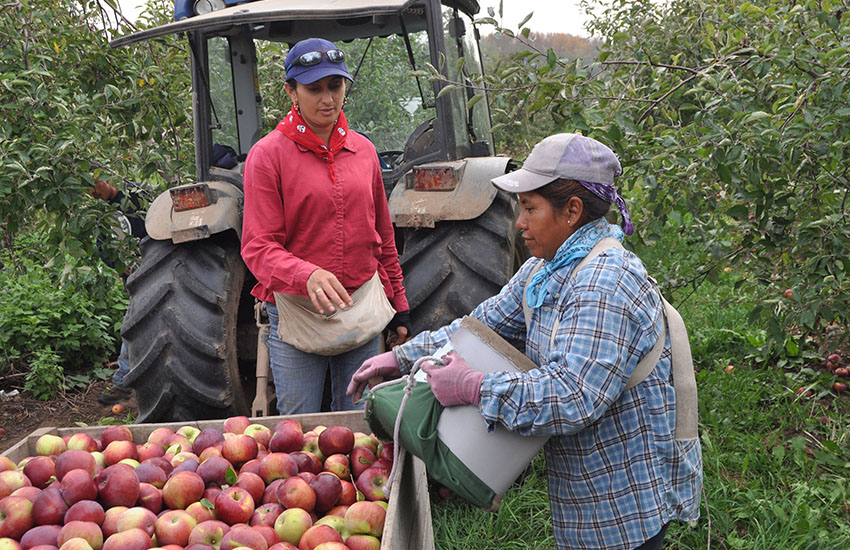
Climate Change and the Agricultural Workforce

In the agricultural heartland of the United States, the results of climate change are increasingly evident. The phenomenon of climate change, which is characterized by irregular weather patterns and escalating weather extremes, is exerting substantial influence on the nation’s agricultural labor force. Using data from the National Agricultural Workers Survey (NAWS), conducted by JBS for the Department of Labor since 1989, we examined the impact of extreme weather events on the crop worker labor force.
Our analysis makes use of a pair of event studies focusing on two recent extreme weather events: Florida’s extreme 2004–2005 hurricane seasons and California’s extreme drought between 2012 and 2017. Florida’s extreme hurricane seasons of 2004–2005 were identified in an analysis of National Oceanic and Atmospheric Administration (NOAA) hurricane data.1,2 We treated 2000–2003 as the pre period and 2006–2007 as the post period. Drought years in California were identified using the US Drought Monitor3 and a case study of California’s 2012–2016 drought.4 We treated 2006–2011 as the pre period and 2018–2020 as the post period in California.
In the analysis of demographic characteristics, we found a decline in the proportion of migrant workers over time in both California (from 29% to 11%) and Florida (from 56% to 36%). In California, migrant workers' average income increased over time, going from $12,500 to $14,999 in 2006–2011 and reaching $20,000–$24,999 in 2018–2020. California's settled workers consistently had higher income than migrants across all periods, with the highest average income observed in the post period ($30,000–$34,999).
In Florida, the average income for migrants was $5,000–$7,499 in the pre-event and hurricane periods, and in the post period it increased to $12,500–$14,999. Settled workers in Florida also consistently had higher average incomes compared to migrants, with the highest income category being $17,500–$19,999 in the post period.
Furthermore, a higher proportion of migrant workers were classified as impoverished compared to settled workers in both regions throughout all periods. Most migrants in California and Florida lacked health insurance coverage, and the proportion of migrant workers with health insurance decreased over time (California: 91% before, 64% during, and 49% after; Florida: 97% before, 98% during, and 83% after). Notably, a higher proportion of migrant workers in California lacked employer-paid health insurance coverage during the drought years (76%) compared to the pre and post periods (33% and 57%).
We also analyzed employment characteristics of workers. Both regional analyses revealed an increase in vegetable crop type for migrant farmworkers during climate events compared to the preceding period (California: 25% to 30%; Florida: 12% to 42%). Conversely, a decrease in fruit and nut crop type was seen during climate events (California: 65% to 57%; Florida: 77% to 35%).
In California, migrant workers experienced an increase in their average number of farm workdays over time (120 days before, 151 days during, and 174 days after). In Florida, the highest average number of farm workdays occurred during hurricane events (202 days), contrasting with the periods before and after (169 days and 181 days). Both regional analyses indicated that a high proportion of migrants had access to drinking water, toilets, and facilities for handwashing throughout all periods. Notably, a higher proportion of migrant farmworkers lacked U.S. work authorization after these severe weather periods (CA: 82% before, 60% during, 26% after; FL: 87% before, 94% during, 71% after).
Our analysis of NAWS data highlights the ongoing impact of climate change on U.S. agricultural workers. We've noted changing employment patterns and evolving living conditions. While these workers have shown remarkable resilience, the findings emphasize the need for workforce support and climate change mitigation policy. As we confront the challenges of climate change, it's crucial to recognize and support those who sustain our food supply, ensuring a sustainable future for both agriculture and our planet.
1 National Hurricane Center and Central Pacific Hurricane Center. (n.d.). Hurricanes in history. US Department of Commerce, NOAA & National Weather Service. https://www.nhc.noaa.gov/outreach/history/
2 Genovese, E., & Green, C. (2014). Assessment of storm surge damage to coastal settlements in Southeast Florida. Journal of Risk Research, 18(4), 407–427. https://doi.org/10.1080/13669877.2014.896400
3 US Drought Monitor. (n.d.). National Oceanic and Atmospheric Administration & National Integrated Drought Information System. Retrieved March 7, 2022, from https://www.drought.gov/states/california
4 Greene, C. (2018). Broadening understandings of drought – The climate vulnerability of farmworkers and rural communities in California (USA). Environmental Science & Policy, 89, 283–291. https://doi.org/10.1016.j.envsci.2018.08.002